How to Calculate Your Average Solar Bill Savings Per Month in California
November 18, 2026
|
California
California homeowners considering solar almost always start with the same question: how much will I actually save every month? It's a fair question, especially with electricity rates from utilities like PG&E, SCE, and SDG&E climbing year after year. Understanding your average solar bill savings per month requires looking at several variables — your system size, your household usage, your utility's rate structure, and whether you add battery storage. This article walks through exactly how to calculate those savings, what real California homeowners are seeing in 2026, and how to maximize your return on a solar investment.
There is no single number that applies to every California home. A homeowner in Fresno with a large pool pump and central air conditioning will save differently than a retired couple in a smaller coastal home in San Diego. That said, most California homeowners who switch to solar see their monthly electric bill drop by 70% to 100%, depending on system size and usage patterns.
Several factors determine where you land on that spectrum:
According to the U.S. Energy Information Administration, California residential electricity rates are among the highest in the country, which is precisely why solar savings tend to be larger here than in most other states.
At its core, calculating your average solar bill savings per month comes down to this formula:
Monthly Savings = (Old Average Monthly Bill) − (New Average Monthly Bill After Solar) + (Monthly Loan or Lease Payment, if applicable)
Here's how to work through it step by step:
For example, if your average bill before solar was $220/month, and after solar your utility bill drops to $35/month, your gross savings are $185/month. If you're financing the system with a $140/month loan payment, your net savings would be $45/month in year one — with that number growing as loan payments eventually end and utility rates continue rising.
Because utility rates and sun exposure differ by region, monthly savings can vary meaningfully across the state. The table below reflects general estimates based on typical system sizes and regional utility rates in 2026.
| Region | Avg. Pre-Solar Bill | Avg. Post-Solar Bill | Typical Monthly Savings |
|---|---|---|---|
| Los Angeles (SCE) | $210 | $30 | $180 |
| San Diego (SDG&E) | $250 | $35 | $215 |
| Sacramento (SMUD) | $180 | $25 | $155 |
| Bay Area (PG&E) | $230 | $40 | $190 |
| Fresno/Central Valley (PG&E) | $260 | $45 | $215 |
These figures assume a correctly sized system with minimal shading and no major changes in household energy consumption. Homes with electric vehicles or pool pumps often see even higher savings potential since they have greater baseline usage to offset.
The size of your solar installation, measured in kilowatts, is one of the biggest levers affecting your savings. A properly sized system should offset close to 100% of your annual electricity usage, though California's current net billing rules make it financially smarter to pair solar with a battery rather than oversize your system purely for export credits.
| System Size (kW) | Avg. Monthly Production (kWh) | Typical Household Fit | Estimated Monthly Savings |
|---|---|---|---|
| 4 kW | ~550 kWh | Small home, low usage | $90–$120 |
| 6 kW | ~825 kWh | Average 3-bedroom home | $140–$180 |
| 8 kW | ~1,100 kWh | Larger home or EV owner | $190–$230 |
| 10 kW | ~1,375 kWh | Large home, pool, EV | $230–$280 |
These numbers are estimates and will vary based on your specific location, roof angle, and shading. A professional site assessment is the only reliable way to know your exact production potential.
Since California shifted to NEM 3.0, the value of exporting excess solar power back to the grid has dropped substantially. This has made battery storage one of the most effective ways to increase monthly savings, because it lets homeowners store midday solar production and use it during the evening — when time-of-use rates are highest and solar panels aren't producing.
Benefits of adding battery storage include:
Homeowners who add a battery to their solar system often see an additional $20–$60 per month in savings compared to solar alone, depending on their utility's time-of-use rate spread. Companies like www.everysun.com design systems specifically with NEM 3.0 in mind, pairing US-made high-efficiency panels with battery storage so homeowners maximize self-consumption rather than relying on low-value grid exports.
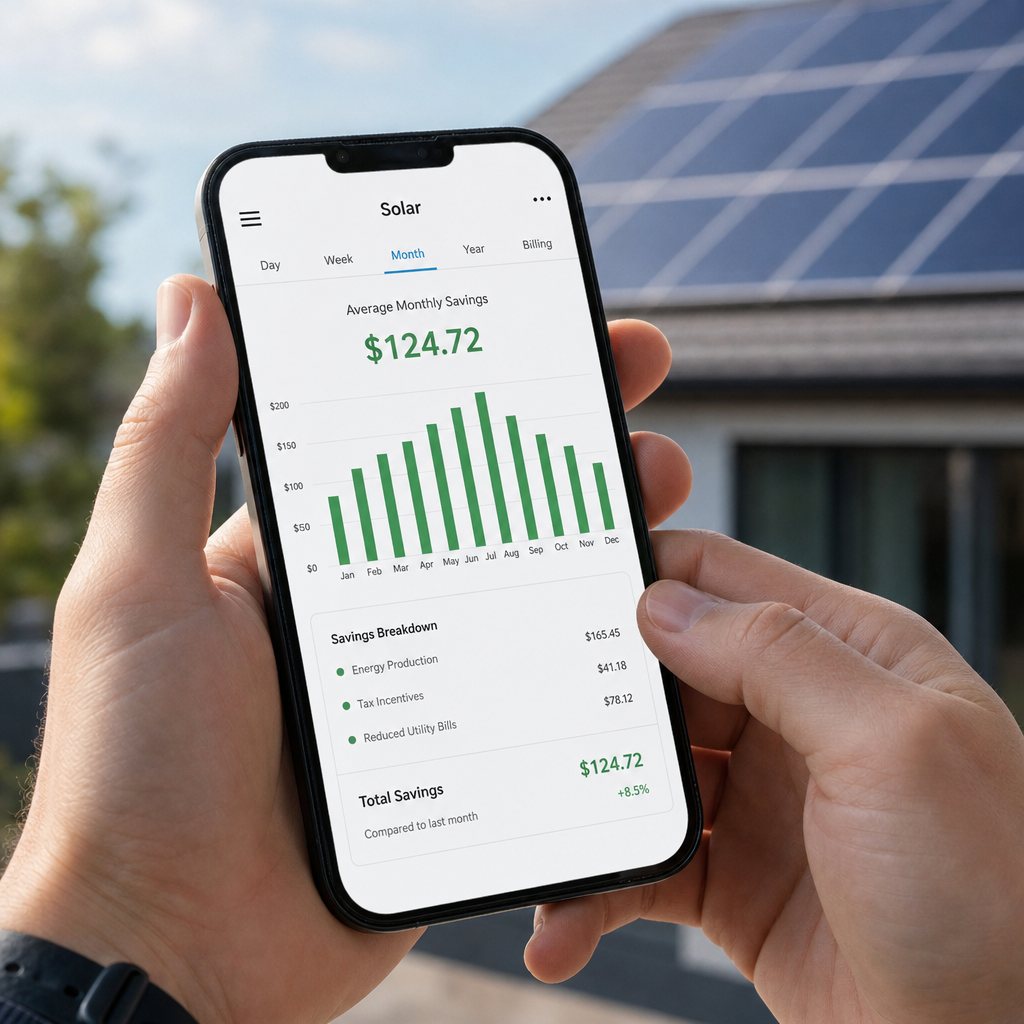
Let's walk through a realistic example for a family of four in the Los Angeles area served by Southern California Edison.
Before solar:
After installing a 7kW solar system with battery storage:
Calculation:
While the first-year net savings may look modest, this is where long-term value becomes clear. As the loan is paid down and utility rates continue to climb — historically averaging 3-5% annual increases — the gap between what the homeowner would have paid the utility and what they're paying now continues to widen. By year 10, many homeowners see their net monthly savings triple or more simply because their solar payment stays fixed while utility rates do not.
How you pay for your solar system directly affects your monthly savings calculation. Each option has different trade-offs between upfront cost, monthly cash flow, and long-term benefit.
| Financing Option | Upfront Cost | Monthly Payment | Long-Term Savings Potential |
|---|---|---|---|
| Cash Purchase | High ($15,000–$30,000) | None | Highest — full ownership of savings and incentives |
| Solar Loan | Low to none | Moderate, fixed | High — savings grow as loan is paid off |
| Solar Lease/PPA | None | Fixed or per-kWh | Lower — savings are smaller since a third party owns the system |
Cash purchases typically deliver the greatest long-term savings since there's no interest and homeowners retain full access to the federal solar investment tax credit. However, financed systems remain the most popular option because they allow homeowners to go solar with little or no money down while still seeing immediate reductions in their monthly energy costs. Everysun offers flexible payment options designed to make solar accessible regardless of which path fits a household's budget best, backed by a 20-year installation guarantee and 25-year product warranties for long-term peace of mind.
Even a well-designed solar system can underperform financially if certain details are overlooked. Avoid these common pitfalls:
Working with an experienced, California-focused installer helps avoid these issues from the start. www.everysun.com combines US-made high-efficiency panels with Swedish safety and installation standards, ensuring systems are designed correctly the first time and perform as projected for decades.

Online calculators can provide a rough starting point, but the most reliable way to know your average solar bill savings per month is a personalized assessment that accounts for your roof, your utility rate plan, and your actual usage history. A qualified installer will typically:
This process ensures the savings figures you're shown aren't just generic averages, but numbers tailored specifically to your home and energy habits.
The average solar bill savings per month for California homeowners typically ranges from $100 to over $250, depending on system size, utility rates, and whether battery storage is included. While the exact number depends on your specific home and energy usage, the broader trend is clear: as utility rates continue climbing and solar technology becomes more efficient and affordable, the financial case for going solar in California keeps strengthening.
The key to maximizing those savings is proper system design — sizing your panels correctly, choosing the right financing structure, and pairing solar with battery storage to navigate California's NEM 3.0 landscape effectively. Homeowners who take the time to get a detailed, personalized assessment rather than relying on rough estimates consistently see better long-term financial outcomes from their investment.
If you're ready to find out exactly how much you could save each month, www.everysun.com offers personalized solar assessments backed by US-made high-efficiency panels, Swedish-standard installation practices, flexible payment options, a 20-year installation guarantee, and 25-year product warranties — giving California homeowners a clear, reliable path to lower electric bills and long-term energy independence.
© 2025 Everysun Inc. All Rights Reserved.


Get Your Free Solar Quote
Request your free quote and see how solar can work for your home and budget